Frontier Geosciences Inc. offers the full suite of services in engineering, related to investigations of dams and reservoirs, corridor studies, foundations, tunnels and cavities, pipelines and cables, harbour, dock and port development, nuclear facility siting, landfills and waste disposal, landslides and slope stability, land subsidence, bridges and pre-mining investigations.
These services include seismic refraction and reflection, frequency and time-domain electromagnetic induction, electrical resistivity, overwater acoustic profiling, ground penetrating radar, self potential, gravity and a variety of borehole techniques. Click on the links below to learn more about these methods:
The acoustic televiewer produces the borehole wall image by transmitting ultrasound pulses with a focused beam, rotating, sonar transducer and recording the travel time and amplitude of reflections from the borehole wall. A 360 degree image is produced, with accurate hole deviation and tool position provided by a three-axis magnetometer and three accelerometers. Televiewers are not adversely effected by inclined holes, with sensors limited only in near-horizontal boreholes. The optical televiewer provides a very high resolution, continuous, oriented, true colour wall image in both air or water filled boreholes. The borehole is illuminated by a circular array of white LEDs mounted on the head of a charge-coupled device (CCD) camera. A projection of the virtual core can be rotated and viewed at any orientation. Televiewers record highly accurate, detailed, oriented caliper and structural information in the logging process. The optical televiewer provides images in natural rock colours representing actual core and requires clear fluid, or an empty, clean borehole. The acoustic televiewer is more versatile in application and works in open boreholes, and in clear or low visibility, ‘dirty’ borehole fluids. When a dipping plane intersects the borehole, the intersection forms an ellipse. Unrolling the ellipse on a two-dimensional plot produces a sine wave, the radial position of which indicates the dip direction and the amplitude indicates the dip angle. The interpretation procedure involves fitting sine waves to the structure evident in the logs. The aperture size of the larger structural features can also be measured. Structural bedding and fractures are illustrated in the acoustic and optical televiewer borehole images. The strike direction, dip direction, and dip angle results of the structural interpretations are shown plotted on a polar diagram. This plot displays strike direction and dip angle as a single point in the projection plane. The distance from the centre of the projection plane represents the dip angle and the azimuth position on the circle represents the strike or dip direction. Borehole seismic surveys are carried out to measure compressional (P) and shear (S) wave velocities of soils or rock surrounding a borehole or between boreholes. The method is carried out either downhole or crosshole depending on the location of the geophone sensors and seismic source. Borehole P and S wave velocity results can be used to determine elastic moduli of soil and rock for earthquake assessment of site response and liquefaction potential, evaluate foundation conditions for machine vibratory loads, determine material damping characteristics, define geological boundaries, locate voids or anomalies in geological layering using tomography mapping, analyze embankment stability, and assist in determination of design parameters for structures. Downhole seismic surveying can be carried out during the drilling program before piezometer installation in either open or cased holes, or at the conclusion of drilling operations. In practice, a triaxial geophone receiver package is lowered down the drillhole to the initial survey depth and locked against the drillhole wall. For deep exploration wells, a high pressure receiver package can be used to depths in excess of 1000 metres. Crosshole seismic surveying measures the seismic velocities of materials between two drillholes. The vertical drillholes are typically placed 3 to 10 metres apart. In order for accurate velocities to be determined, drillhole deviation studies are typically carried out using an inclinometer. The receiver package is the same as that employed in downhole seismic surveying although two packages are often employed in instances where three drill holes are available. Frontier Geosciences has developed a unique crosshole seismic source that can be deployed in small diameter drillhole lining, such as a Slope Indicator casing with an ID of 2.32″ (59 mm). This allows surveys to be carried out in existing drillholes that have been installed for soil or rock movement monitoring. The source is reversible, allowing uphole and downhole shear waves to be generated. Crosshole field procedure consists of lowering the geophone packages and source to the initial survey depth. The source is locked against the casing wall, and a down-going impact is initiated. The incident shear wave is recorded on the vertical geophone of the receiver packages, and is digitally stored in the seismograph. The up-going impact is similarly recorded and stored. The source is then disengaged and lowered with the receiver packages to the next recording position where the procedure is repeated. Seismic wave arrivals are plotted on depth sections with the reversed shear wave traces plotted on the same datum to facilitate arrival time picking and phase correlation of events. Velocities are calculated and similar values grouped into layers based on distinct compressional and shear wave velocities. Casing deviation tools provide accurate measurements of a drillhole’s orientation in three dimensions. The instrument uses a series of measurement stations, or ‘shots’ and records orientation by the measured dip and azimuth readings. Historically, two methods existed; photographic tools determined dip and azimuth using photographs of the graticule on a floating compass ball, and the mechanical tools used angular scales on a locking gimbaled compass. Both were time-consuming and subject to reading errors and a variety of mechanical problems. The modern electronic tool uses digitised signals from state-of-the-art solid state sensors to determine dip and azimuth. The electronic tool is capable of taking thousands of shots in any orientation, which boosts efficiency and permits entirely new ways of using the tool. Data are provided in spreadsheet format ready for import into mapping and other software packages. The main advantages over the previous instruments are improved efficiency, speed and digital accuracy. The electronic survey tool employs a three-component accelerometer, a three-component flux gate magnetometer and a computer. Data from the accelerometer are used to determine the dip or inclination of the tool with respect to the vertical. Data from the magnetometer are used to determine the azimuth of the tool with respect to local magnetic north. Additional parameters such as tool face, magnetic field strength, and magnetic dip are also computed. The computer provides power management, timekeeping, data digitising, data storage and communication. Multishot mode is the preferred method of data gathering. The tool is first connected to a control computer which synchronises the clocks and starts the survey. Since the tool can store thousands of shots, the shot interval is usually set to 10 or 15 seconds. After disconnecting from the computer, the tool is lowered or pumped into the hole. An efficient way to run the tool is to pump the tool in once a hole is finished. The tool is extended in front of the bit on nonmagnetic rods, and is set to take shots every 10 seconds. Thus, a detailed survey with shots at every joint can be taken with almost no time cost. With a wireline interface, the same tool can also be used in real-time steering or orientation applications by connecting it to a single-conductor wireline. Tool face, dip, and azimuth can then be observed on the control computer at 5 second intervals. The tool will operate over a 10 km wireline. One of the great advantages of the casing deviation tool over the old photomechanical tools is that magnetic diagnostics are provided. The tool provides readings of magnetic field strength and magnetic field dip. Deviation in one or both of these parameters can be used to detect azimuth interference from ore bodies and drilling equipment. These diagnostic parameters can also aid the geologist in defining the geological setting and locating contacts. The electric field technique uses a transmitter antenna which radiates an electric field voltage and dipole receiver antenna with associated electronics. The transmitter and receiver antennae may be in boreholes separated by a few metres to as much as 120 metres, and in holes up to 600 metres in depth. These antennae are controlled by a cable and winch system that allows the generation of a very large number of transmitter to receiver measurements that sample the volume between the holes. The resulting multiple ray path data is then processed to create a tomogram. This tomographic image shows higher levels of attenuation of the signal where more conductive materials are present, and lower values in more resistive areas. In operation, the receiver antenna is held at a constant depth and a complete pass of the borehole is carried out with the transmitter antenna. The receiver antenna is then incremented to the next depth point and the process is repeated. This procedure results in the very large number of ray paths that are required for the tomogram data processing. The tool has widespread application in mine development, geotechnical, environmental, groundwater and enhanced oil recovery applications. Applications for the tool may include: Ground penetrating radar (GPR) is an electromagnetic profiling technique utilised for high resolution mapping of subsurface features. It is commonly applied to mapping soil layers, depths to bedrock, buried stream channels, rock fracture zones and cavities; buried waste materials (both bulk and drummed); buried utilities (both metallic and nonmetallic); and buried cultural features. The technique operates on the principle of transmission and reflection of short duration electromagnetic pulses from a transducer that is moved across the ground surface. The energy radiates down through the subsurface and is reflected back to the receiving antenna from subsurface electrical discontinuities. Variations in the continuously recorded returning signals are sent to a control unit for processing and display. The record produced by the GPR is a continuous, cross-sectional picture or profile of subsurface conditions within the depth of penetration. The time the electromagnetic pulse takes to travel from the transmitting antenna to the buried object or interface and back to the receiving antenna is proportional to the depth of the buried object or interface. This time is a two-way travel time and is dependent on the dielectric properties of the media through which the pulse travels. The dielectric properties (electrical permeability and conductivity) are a function of the composition and moisture content of the subsurface soil and rock materials. The depth of penetration is highly site specific and is limited by attenuation of the outgoing pulse. The GPR system is more effective in seeing through insulators to conductors. Greater penetration is obtained in dry, sandy, and rocky soils and little penetration is obtained from moist, clayey conductive soils. Penetration generally ranges from one to ten metres although penetrations of more than 30 metres have been achieved under certain ideal conditions. A major advantage of GPR is the continuity of recorded data; it provides a continuous vertical profile. Data is also acquired at a relatively high speed. In some applications, work can be accomplished by using a vehicle or boat to tow the radar antenna. The induced polarisation (IP) method is an effective means of exploration for disseminated mineralisation. The method utilises significant electrical current introduced by electrodes at the ground surface to provide two distinct measurements of the electrical properties of earth materials at the survey site. The first of these is the measurement of the electrical resistivity. This large signal is the capacity with which earth materials can support the flow of electrical current. Amongst the many uses of this parameter in mineral exploration for instance, is defining silicified zones which may be a favourable rock alternation indication. The second measurement taken in IP surveys is the chargeability. This measurement indicates the degree to which particular mineralisation is present in the rock. Grains of metallic sulphide, graphite, and sometimes clay disseminated throughout a rock mass result in a change in the dispersion of electrical properties as a function of frequency. The effects of polarisation are measured by noting the potential difference developed between two measuring electrodes. This may be used to provide a measure of the relative presence of metallic sulphides in mineral exploration. Chargeability and resistivity measurements are taken simultaneously during the survey. Chargeability measurements involve dynamic signals that are much smaller than signals required to obtain corresponding resistivity data. The results therefore are susceptible to noise of all types. A new means of acquiring higher resolution induced polarisation data employs the full waveform method. In this approach to IP surveying, the entire waveform is continuously recorded, usually from several receiver dipoles simultaneously. As the full received waveform is available for processing, self potential drift, telluric effects and several other noise sources can be efficiently identified and removed from the chargeability signal. This results in usable chargeability data at lower signal levels as compared to conventional IP receivers. The result with full waveform data acquisition is more accurate and higher resolution IP data in areas of conductive overburden or in areas of weak signal or deep penetration where signal strength is more readily attenuated. Frontier Geosciences have developed IP receiver technology that facilitates the recording of full waveform data in an IP investigation. This generally results in greater resolution and penetration over conventional IP data acquisition. The data is presented in raw pseudo-section format or inverted by software such as the Loke inversion program. IP surveys have been used extensively in mineral exploration. Recently, IP has been applied to hazardous waste landfill and groundwater investigations to identify clay zones. The magnetic method records variations in the earth’s magnetic field for small or large scale surveys. Modern magnetometers are portable, highly sensitivity and can record a large amount of data. They are also extremely versatile having 0.01 nT (nanoTesla) resolution and 0.2 nT absolute accuracy over its full temperature range. In the Overhauser magnetometer, a sensor head mounted on a 56 cm long aluminum staff contains an electron enhanced liquid. Using electron-proton coupling, a strong RF current stimulates the electrons, and this energy magnetises the protons in the liquid. A large polarisation with strong signal amplitude results. A short pulse follows, which deflects the proton magnetisation (secondary magnetic field) into the plane of precession (earth’s magnetic field). A slight pause in the process allows the electrical transients to die off, leaving a slowly decaying proton precession signal above the noise level. The proton precession frequency is then measured and converted into magnetic field units. The data is a measurement of the earth’s magnetic field plus any effect on the secondary magnetic field by ferrous objects and/or high concentrations of ferromagnetic minerals. Field operations consist of conducting measurements at even spaces across a grid. Specific intervals are dependent upon the size of survey and accuracy required. A GPS can be integrated with the instrument and configured to take a reading at each station. The magnetometer can be used in ‘walking mode’, for collection of nearly continuous data. Similar to airborne magnetic surveys, the unit records data at a discrete time interval, such as 0.2 seconds, while the operator walks along the survey line. At pre-established survey positions, the magnetometer assigns fiducials to the data, and the data are linearly interpolated for their grid positions. This allows accurate positioning information which improves contouring of the data and is advantageous in large scale mineral surveys. A base station can be used to perform temporal correction and levelling of the field data. Magnetic data is logged digitally in the instrument memory together with date, time and GPS coordinate information. The results are downloaded to a field computer for further processing once diurnal corrections have been applied. Presentation is normally in the form of coloured contour plans. For detailed analysis, generic magnetic modelling programs are used to identify anomalies. Around areas of interest, multiple lines crossing the anomaly are recorded and modeling of these data will provide information regarding size, shape and amplitude and dip of the response. Developments in the field of dispersion curve analysis have resulted in the availability of the MASW method for reliable determination of shear wave velocity distributions in the subsurface. MASW data is collected in the compressional wave surveying of a transect. The method is based on the fact that shear wave velocity is the dominant influence on Rayleigh waves. The MASW method of determining the shear wave profile can be carried out in the active or passive mode, or a combination of the two methods. In the passive mode, background noise or micro tremors are utilized as a signal source, thus an active energy source such as a dynamite or weight drop system is not required. In urban environments for instance, the abundant background noise from street traffic provides the necessary surface wave energy for data acquisition. In quieter environments, the active source method is used. In the passive source approach, a long record (16 seconds) is obtained. The record lengths for active source work are planned to be sufficiently long to capture the full surface wave train. Interpretation of the MASW data involves a wavefield transformation of the seismogram record. This converts the seismogram from a multichannel shot gather to a dispersion curve that shows the phase velocity of the signal as a function of frequency. The fundamental event is picked on the dispersion curve and the data inputted into the SeisImager modelling program. The resulting model reveals the shear wave layer velocity structure, and is generally plotted at the centre of the seismic spread. The MASW method is able to identify zones of lower velocity beneath those of higher velocity, often described as velocity inversions. The multi-spectral analysis of surface waves (MASW) method carried out in the Active mode is generally the most accurate for determination of shallow, shear wave velocities. The method entails collection of data over a geophone array with the results plotted as a single vertical profile at the centre. Limitations include reflection and scattering of surface and body waves due to extreme surface topography and inhomogeneous conditions in the subsurface such as boulder concentrations or isolated soil lenses with contrasting properties. Ground penetrating radar (GPR) is an electromagnetic profiling technique utilised for high resolution mapping of subsurface features. It is commonly applied to mapping soil layers, depths to bedrock, buried stream channels, rock fracture zones and cavities; buried waste materials (both bulk and drummed); buried utilities (both metallic and nonmetallic); and buried cultural features. The technique operates on the principle of transmission and reflection of short duration electromagnetic pulses from a transducer that is moved across the ground surface. The energy radiates down through the subsurface and is reflected back to the receiving antenna from subsurface electrical discontinuities. Variations in the continuously recorded returning signals are sent to a control unit for processing and display. The record produced by the GPR is a continuous, cross-sectional picture or profile of subsurface conditions within the depth of penetration. The time the electromagnetic pulse takes to travel from the transmitting antenna to the buried object or interface and back to the receiving antenna is proportional to the depth of the buried object or interface. This time is a two-way travel time and is dependent on the dielectric properties of the media through which the pulse travels. The dielectric properties (electrical permeability and conductivity) are a function of the composition and moisture content of the subsurface soil and rock materials. The depth of penetration is highly site specific and is limited by attenuation of the outgoing pulse. The GPR system is more effective in seeing through insulators to conductors. Greater penetration is obtained in dry, sandy, and rocky soils and little penetration is obtained from moist, clayey conductive soils. Penetration generally ranges from one to ten metres although penetrations of more than 30 metres have been achieved under certain ideal conditions. A major advantage of GPR is the continuity of recorded data; it provides a continuous vertical profile. Data is also acquired at a relatively high speed. In some applications, work can be accomplished by using a vehicle or boat to tow the radar antenna. The overwater acoustic profiling method is a seismic geophysical technique which is useful for sub-bottom sediment layering identification, depth to bedrock determination and sub-bottom hazard studies. The method consists of towing an energy source appropriate for the depth of investigation and bottom materials behind a survey vessel along a traverse line. The acoustic signal reflected from the sub-bottom is received by a towed hydrophone array and amplified and digitally recorded as a continuous profile. In the field, the data are visually reviewed in real time on the high resolution display of a notebook computer. Energy sources range from high frequency systems suitable for detailing the thickness of a few metres of soft organic material in a fresh water lake environment, to powerful boomers or airgun arrays where deeper sub-bottom penetration is required. Overwater positioning is accomplished using a high resolution GPS system in realtime or post-processing differential dynamic mode. Bathymetry information is recorded synchronous with the positioning and seismic information using a narrow beam fathometer. Large areas can be covered quickly and economically, resulting in the classification of materials and detailed information on the sedimentary layers above rock. Interpretation of the data employs the SMT 2d/3dPAK which accepts the overwater seismic profiling data in SEGY format together with positioning, bathymetry and other information. The package provides rapid section and plan seismic reflection interpretation with complete horizon tie management in a fully integrated workstation environment. Products include sections, detailed horizon contour maps and layer isopachs. Used in conjunction with overwater seismic refraction surveys the approach allows classification of sediment and bedrock types based on their acoustic velocities. Higher velocity materials correspond to more competent sediments. Applications include the use of overwater profiling surveys to provide detailed subsurface information in support of geotechnical engineering work for harbour facilities. This may be as simple as determining that sufficient sediment is available above bedrock for pile driving, or may be employed to provide detailed subsurface mapping, which together with barge drilling, furnish the critical geotechnical information for berth facilities foundations, caissons, etc. Pre-dredge surveys may be carried out, together with bathymetric surveys, to identify hazards such as shallow bedrock, and to classify the sediment types. This information determines how much volume is to be removed by dredge operations, and allows appropriate deployment of suction versus clamshell dredging. Post-dredge bathymetry completes the project by verifying dredge contract fulfillment, and that the depth meets all navigation requirements.
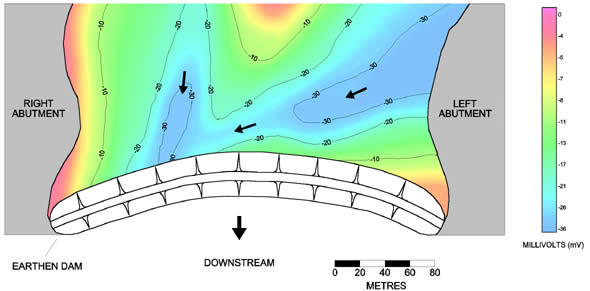
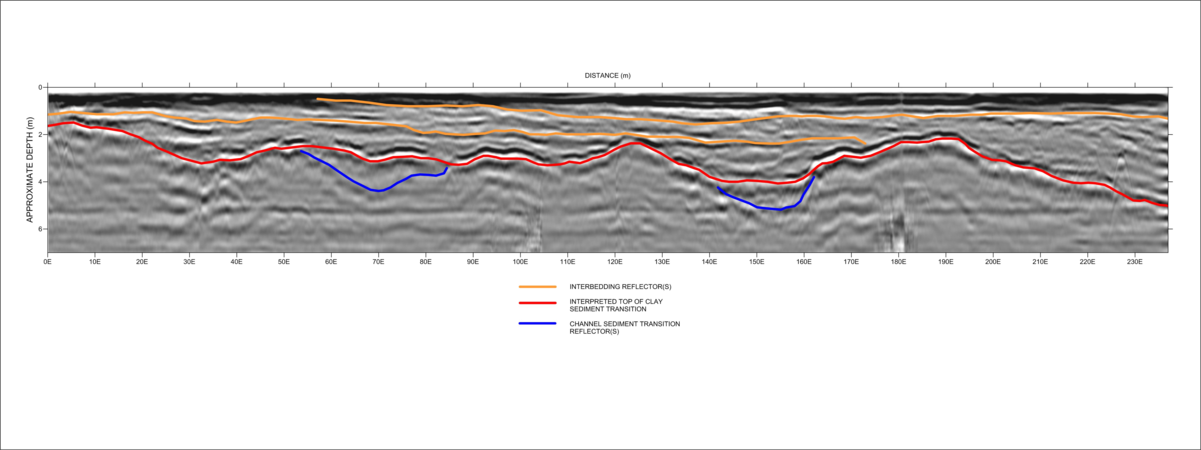
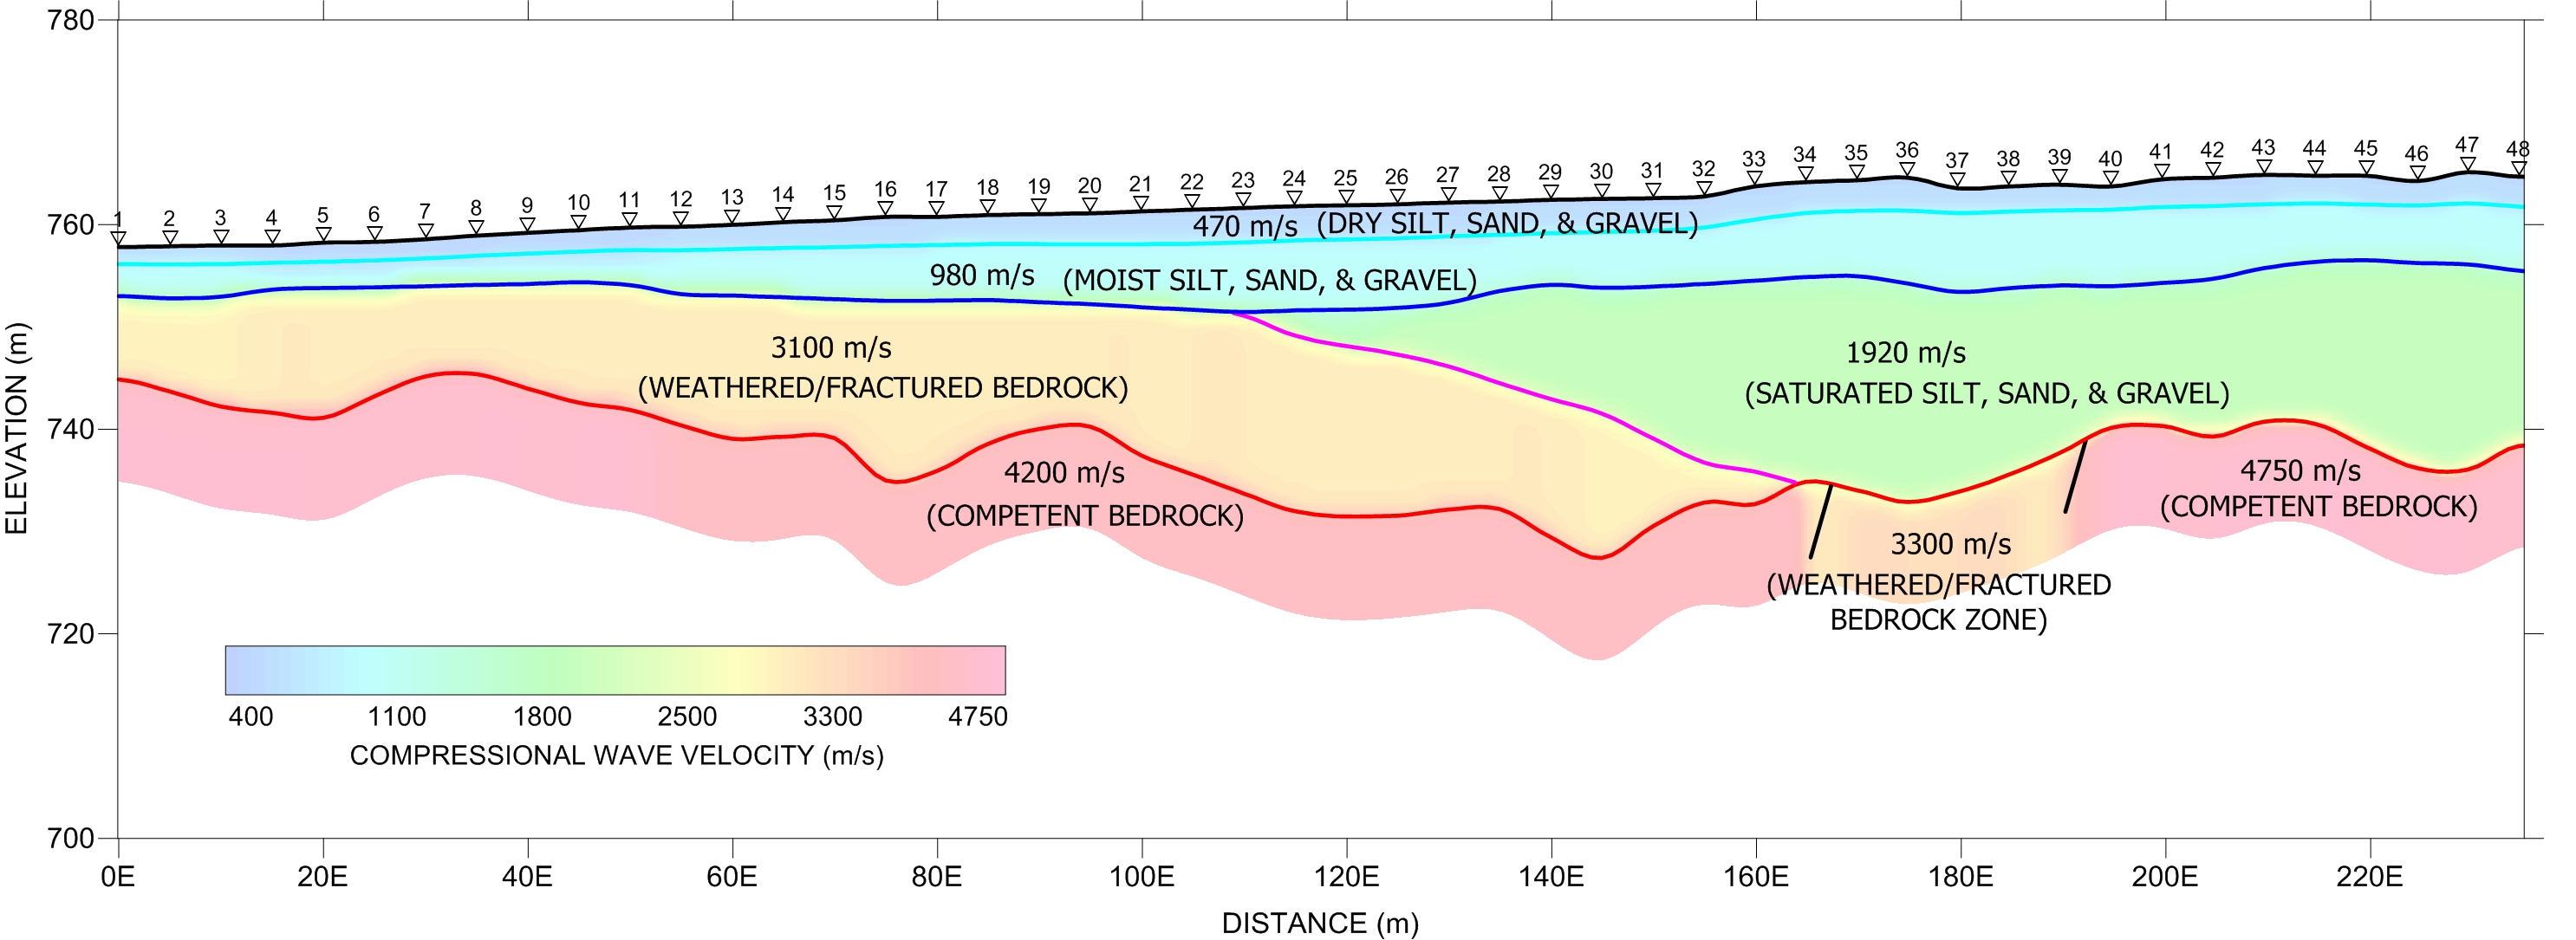
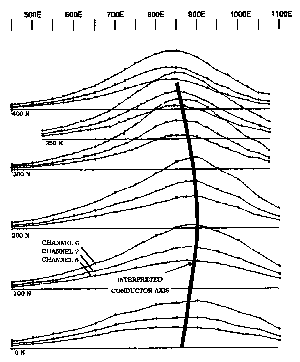
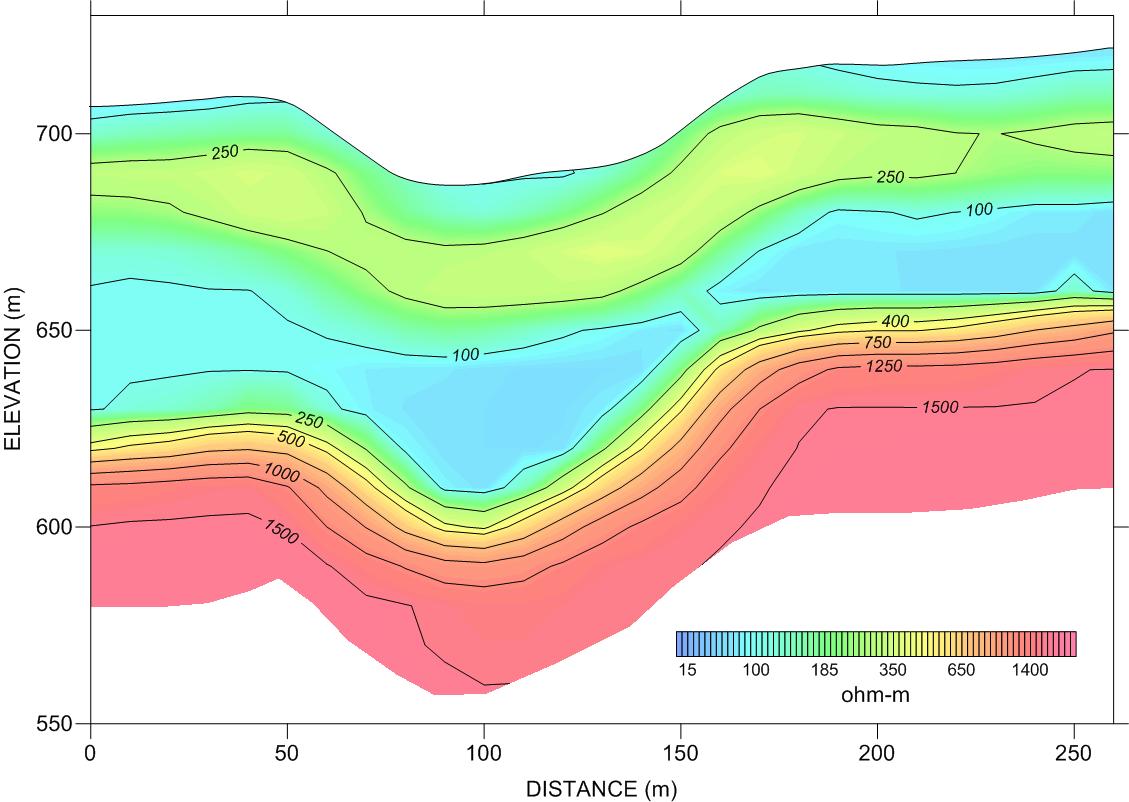
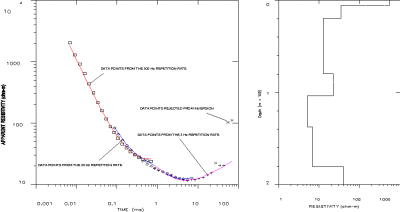
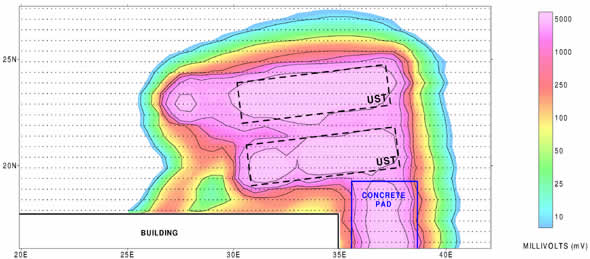
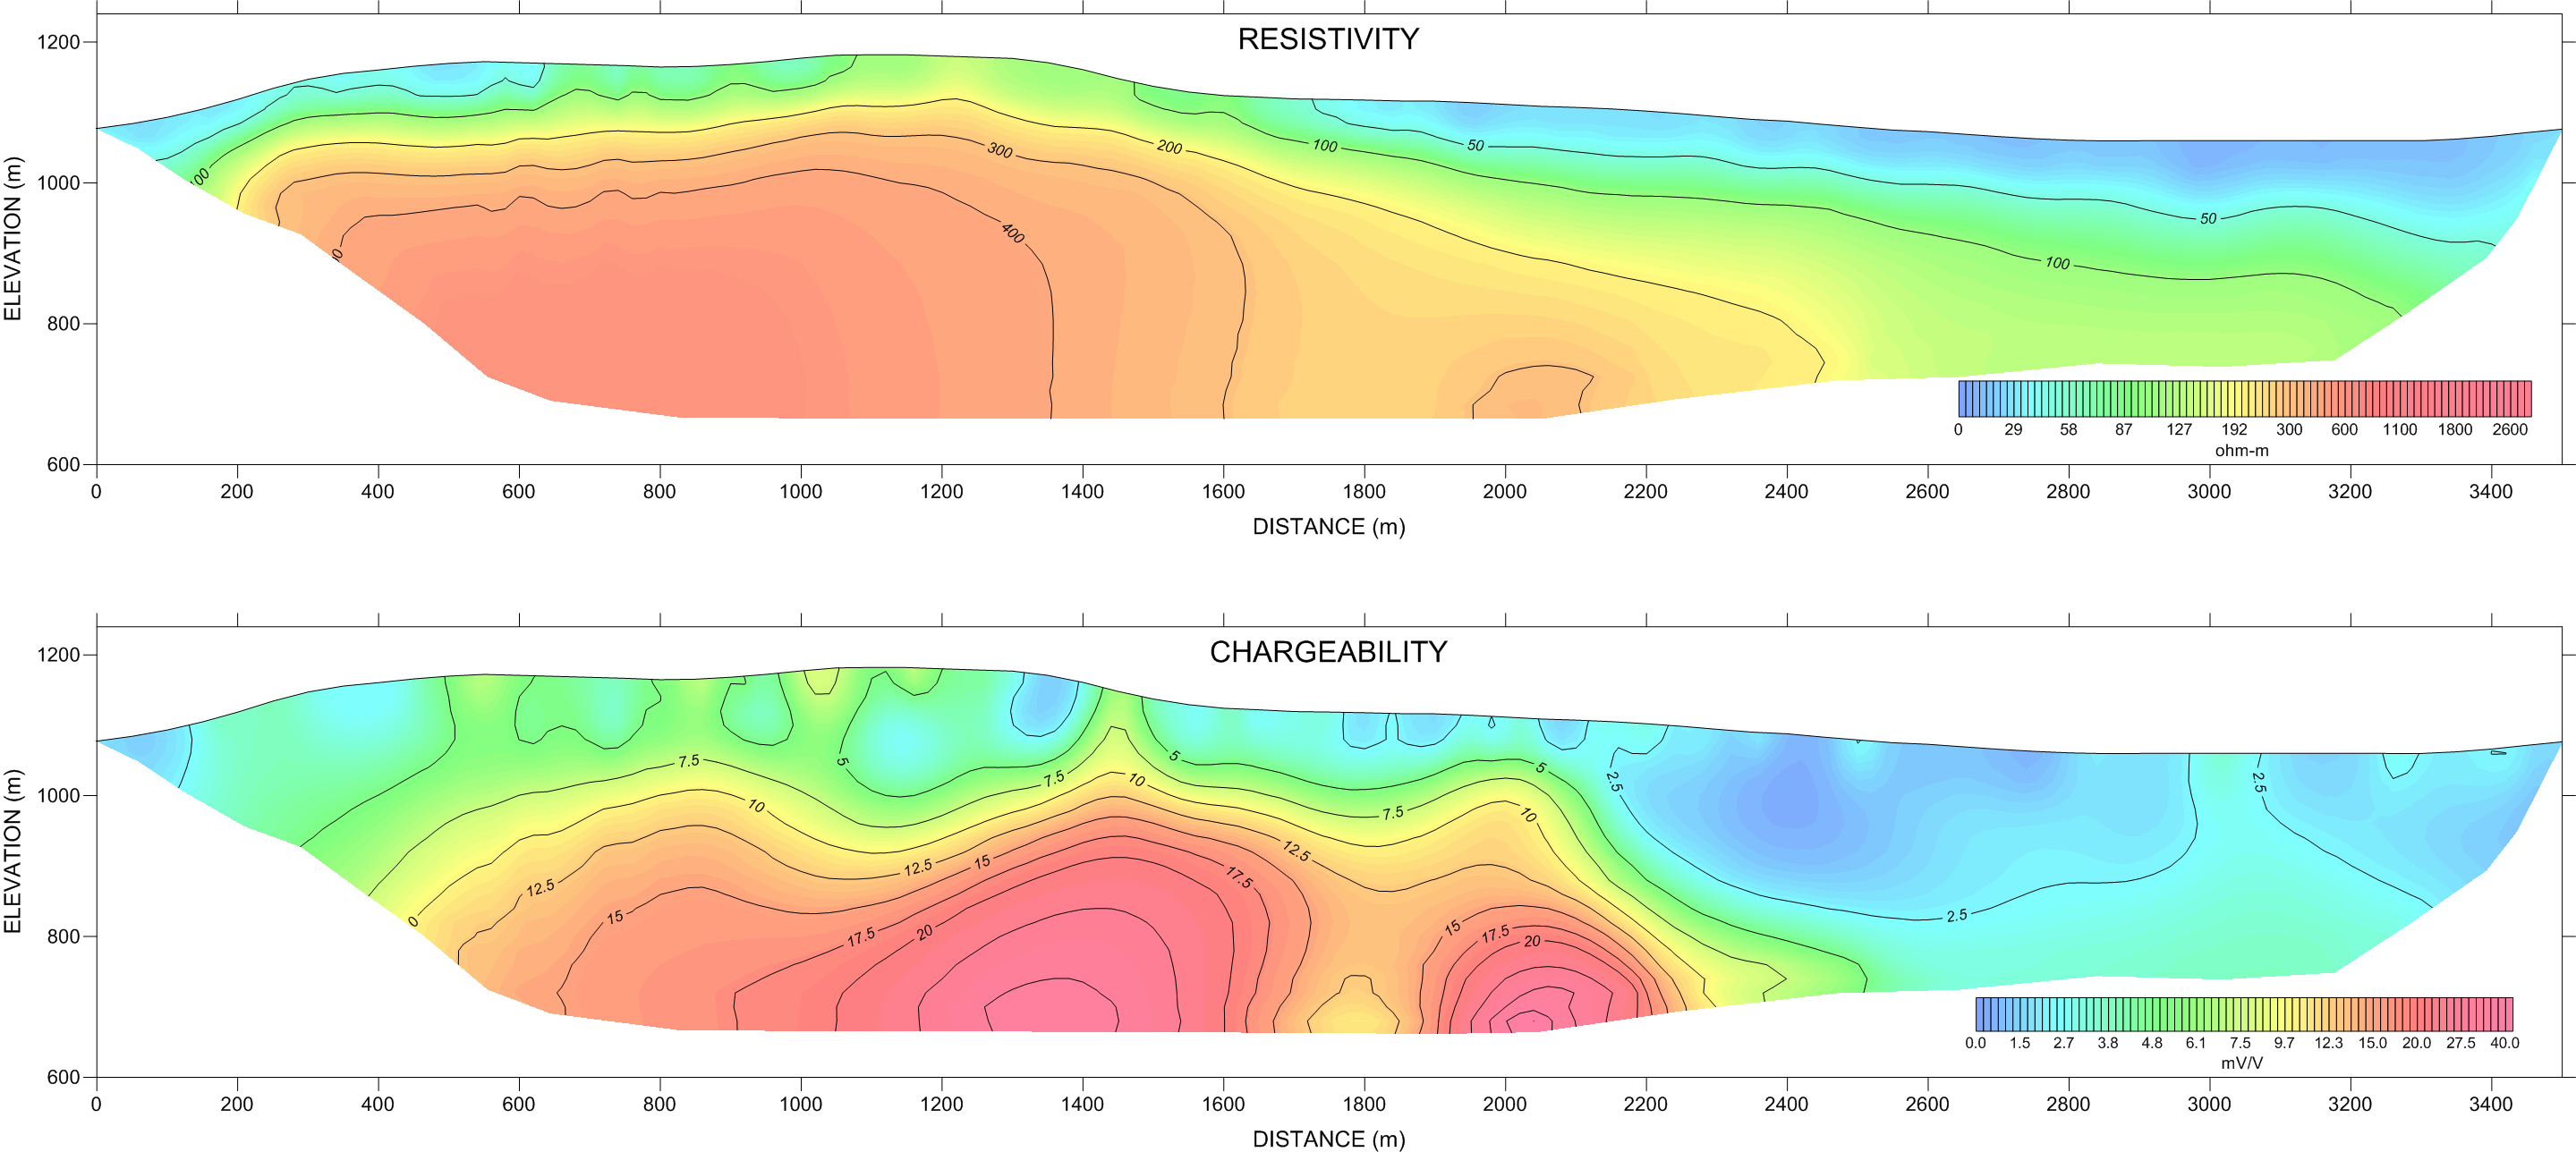
The goal of a high resolution seismic survey is to provide an image of the subsurface that is as detailed as possible, within the limits imposed by the nature of acoustic wave propagation in the earth. The 2D seismic method entails propagation of the acoustic waves through the earth from a surface pattern of source and receiver points. Energy is introduced by using one of a number of possible seismic sources. Common sources include seismic shotgun, small dynamite charges, weight drop or rammer sources. In some environments, such as gassy deltaic sediments, a shear wave source and geophones are used. The returning wavefield is recorded in the seismograph from a spread of geophone receiver groups. The number of geophones used may be as few as 24 in favourable environments to many times more where high subsurface sampling redundancy is required. The survey procedure entails collection of a seismogram, then advancing the energy source a fixed distance down the survey line and repeating the process to receive another seismogram. This method known as common mid-point (CMP) provides a very high degree of redundancy of sampling of the energy received from a given reflector at depth. The redundancy is used in the data processing procedure to develop a high fidelity image of the subsurface. If all receiver locations are used as shot points, the multiplicity of data on one subsurface point (called CMP or CDP fold) is equal to one half of the number of recording channels. A number of seismic events are present in each seismogram in addition to the reflections of interest. Data processing steps designed to attenuate this unwanted energy, and enhance the reflections of interest are carried out. The ultimate product of the reflection processing is a corrected cross section with reflection events ready for interpretation. The SEGY formatted seismic data is imported into the Seismic Micro Technologies (SMT) 2D/3D seismic interpretation package, together with survey line position information. This software is a comprehensive 2D/3D seismic interpretation program that provides interpretive and horizon picking tools, integrated into a map and section database, entity management, and display system. The initial step in the seismic data interpretation process is the correlation of the major geological structures to seismic reflectors. The process of tracing reflectors within a given seismic line, and from line to line at tie points, requires careful phase correlation of the events. During this process sedimentational character, and stratigraphic features and faulting are considered. A velocity model is developed during processing, and by correlation with borehole geologic and velocity logging information. The times associated with each of the interpreted reflectors are then converted from time sections into depth sections using this model. Final products include colour contour maps and sections and isopach maps of geologic horizons. As well, volumetric computations for regions and horizons may be developed. The seismic refraction method, due to its versatility, is one of the most commonly used geophysical methods in engineering, mining, groundwater exploration and environmental site investigations. Based on favourable density contrasts that generally exist between geological materials, the refraction method is utilised to provide detailed information on the distribution and thicknesses of subsurface layers with characteristic seismic velocities. Overburden and basement rocks may be classified to some degree to discriminate for example, glacial tills from gravels or highly fractured rock from competent rock. The technique is widely used for rippability assessment of bedrock. Field operations involve laying out a seismic cable with several geophone detectors (usually 12 or 24), at the takeout points on the cable. In some situations, such as in saturated sediments, shear wave information is more diagnostic of layer information than compressional wave. In this case a shear wave source and shear wave geophones are employed. Overwater, pressure-sensitive hydrophone receivers are substituted for the geophones. Geophone or hydrophone spacing is strongly dependent on the depth of search and the desired resolution for a given survey. A pattern of shotpoints is then executed within and off the ends of the cable and the seismic wave arrivals for each geophone are recorded in the seismograph. The key piece of recorded information is the time of the first arrival. This arrival is the direct wave, or more commonly, the refracted wave which occurs when seismic energy propagates along a geological interface having a sufficiently great velocity contrast. This contrast must consist of a higher velocity zone underlying a lower velocity zone, fortunately the most common geological condition. The energy source may be sledge hammer blows in extremely shallow search surveys (less that 10 metres), a shotgun source when overburden conditions allow, or explosives where depth and/or energy attenuation is a deciding factor. The maximum depth of exploration is limited by space requirements for long cable layout and favourable shooting conditions for explosive charges. In general, a seismic cable three times the expected depth of exploration is required to ensure sufficient bedrock or basal layer arrival information to provide depths independently beneath each geophone location. Interpretation of the seismic data involves resolving the number of velocity layers present, the velocity of each layer, and the traveltime taken to travel from a given refractor up to the ground surface. This time is then multiplied by the velocity of each overburden layer to obtain the thickness of each layer at that point. The analysis of the refraction data is assisted by the use of an integrated suite of programs. As well, inversion programs such as the Optim analysis program are used. In some circumstances companion surveys may be carried out to provide correlative information. Transient electromagnetic soundings, resistivity soundings, or multielectrode resistivity surveys provide a means of assessing additional layering information. Frequently, the marine seismic refraction method is a companion survey to marine seismic reflection profiling surveys. Seismic tomography utilizes multiple raypaths to achieve 3-D modeling of crosshole seismic data. Historically, cross hole seismic was limited to individual shots in a horizontal plane. Improved software and equipment now allows multiple raypaths to be recorded for each shot location. The raypaths provide a wealth of information across the entire volume between boreholes. The ability to perform 3-D analysis is an important advantage in counteracting the problem of non-uniqueness with crosshole data. Data production is maintained by utilizing a string of geophones in the receiver borehole creating 24 raypaths for each shot. The information is recorded in the field using the Smartseis S24 seismograph. Geophone separation and interval between source shots is dependent upon the survey objectives and site conditions. Up to 50m borehole separation can be achieved where ground conditions and noise are at acceptable levels. Seismic tomography is processed using the GeoTomCG 3-D package which provides graphical displays of velocities, raypath densities, and other parameters for data analysis and modeling. Plots for quality control include travel time versus distance, residual versus raypath angle, velocity versus raypath angle, and others. When needed, anisotropy can be performed on required points within the grid to improve the modeling of anomalies. Source and receiver coordinates are calculated to provide an accurate 3-D grid. The tomographic analysis calculates velocities at points across the grid using the simultaneous iterative reconstruction technique. This modification of the initial velocity values consists of repeated cycles of three steps; forward computation of model travel times, calculation of residuals, and application of velocity corrections. A typical presentation of the data is by 3-D numerical results or 2-D slices of the velocity profile across areas of interest. According to the geology and number of boreholes, multiple slices will be taken to clearly present the 3-D analysis in full. Interpretation features include depth of bedrock, layers within the surficial soils, voids and shear zones. The figure illustrates crosshole seismic tomography data combined with the geological log of the borehole. Higher velocities are seen within the dense sandstone regions whereas slower velocities are present in the conglomerates and weaker sandstone layers. Using a combination of electromagnetic instruments, a fast, accurate and cost-effective system of mapping soil conductivities is available. Electromagnetic terrain conductivity surveying is carried out using the Geonics Ltd. Model EM-31 and EM-34 terrain conductivity instruments. The EM-31 is an electromagnetic instrument consisting of a transmitter coil and a receiver coil at opposing ends of a 3.66 m boom. Together with the electronics package, the instrument is one person portable and has an effective penetration depth of six metres. The instrument is calibrated to adjust for the reduction of reading due to the instrument being held 1 metre above the surface. The EM-34 is a two man version of the EM-31, designed to achieve greater penetration depths. The system consists of a separate receiver and transmitter, and using 3 inter-coil spacings, readings down to 60 metres are possible. Both the EM-31 and EM-34 are operated at audio frequencies and make use of the effect that earth conductivity information is contained in the behavior of the phase of the received EM field. This phase information is calibrated to read directly in milliSiemens/metre (mS/m), units of conductivity. They can operate over a range of conductivities from a few mS/m to thousands of mS/m. High rates of production are possible with both of these instruments as they are easily portable. In practice, grids are established, usually with a minimum of 5m intervals between stations and lines. In some cases, the integrated GPS system may be used for automated positioning information. If both instruments are being used together, a detailed image of the near surface and deeper soils is ascertained when each of the separation distances for the EM-34 are utilized. Both instruments are relatively unaffected by metallic objects and power lines, but care should be taken nearby such objects. The advantages of using these instruments are improved conductivity resolution and the ability to operate over terrain where current injection problems occur. The digitally recorded data is downloaded and plotted. The process is quick and easy to interpret. The usual presentation would be a plan view of the site with contours of the recorded conductivity. If varying EM-34 separations were used, multiple maps would be produced to ease interpretation between depths. The figure below illustrates the results of an EM 31 survey to detect possible elevated conductivities due to the presence of any chlorides and dissolved salts in the earth materials and shallow groundwater. A wide band of elevated soil conductivity is seen running west to east from the salt shed. Outlining the extents of these elevated soils is important in the remediation process. The Geonics Protem equipment is a flexible and effective time domain electromagnetic system. In the surface mode, three transmitters and three receiver coils allow the system to be tailored specifically to the desired depth of exploration, using a wide range of transmitter loop sizes. The instrumentation may also be used in moving horizontal loop mode, central or offset sounding mode or in downhole mode. In the downhole mode, a downhole receiver coil and surface transmitter loops are used to determine attitude and position of intersected or offhole conductive mineralization. The rapid reduction of the primary magnetic field causes eddy currents to flow in any nearby conductors, with a characteristic decay which is a function of the conductivity, size, and shape of the conductor. The decaying currents generate a secondary magnetic field, the time rate-of-change of which is sampled by the receiver across 20 channel windows . The windows are logarithmically spaced in time during the decay of the field, sampling from as early as 0.087 ms to as late as 70.4 ms after the turn-off time of the transmitter. The system can record any receiver coil orientation, either maximum or minimally coupled. The data are recorded digitally, and each channel can be plotted in profile. The interpretation involves the inspection of the data to determine conductor position, type and quality. As well, observation of the decay behavior of the responses, and correlation of the responses in the vertical and horizontal components is involved. The responses may then be compared with simple models to assist in the determination of attitude and depth. Transient E.M. in the time domain has the advantage of better resolution of conductive targets in the presence of conductive overburden and host rock. The system can sample data over a wide spectral range in a short time, and is free from DC bias shifts at different frequencies, resulting in accurate resistivities directly comparable to those found by conventional DC resistivity equipment. As well, it is relatively insensitive to misalignment of the transmitter and receiver coils and minor errors in intercoil spacing, thus eliminating the need for highly accurate chaining and making the system particularly useful in rugged topography. The transmitter loop is used as the source for numerous survey lines, so field operations are very economic. Cable-free operations by use of the crystal reference, the high portability of the receiver and receiver coil, and the lack of need for extremely accurate chaining result in high field production rates. In addition to their employment for the direct detection of conductive ores, Transient E.M. methods can also be used in relatively resistive environments that often occur when prospecting for aggregates or aquifers, or when measuring the depth to bedrock or the thickness of permafrost. Either as a tool for general geological mapping or for rapid continuous profiling of conductive mineralization, the transient electromagnetic method is an effective and reliable technique. The transient electromagnetic profiling method allows rapid acquisition of true depth, 2-D resistivity images of geological profiles. Using the Geonics Ltd. PROTEM system, detailed vertical and lateral variations in material resistivities may be obtained with a minimum of field time and cost. TEM profiling consists of a coordinated sequence of TEM soundings at a station spacing that is sufficiently close that a detailed image of the lateral variations in layer bahaviour may be developed. The system is comprised of a PROTEM receiver and is used with a family of transmitters, each suited for a range of depth of exploration. The TEM47 is optimised for sounding work to a depth of approximately 70 metres. The higher powered TEM57 transmitter is used to provide the intermediate and lower frequency repetition rate required to obtain deeper information. In operation, a transmit loop appropriate for the depth of exploration is laid on the ground at the measuring station. A common loop size for shallow work is 5 by 5 metres. Profiling to depths of greater than this is done by using the multiple ranges of the TEM57 transmitter and by deploying larger loops. The example shown below utilised 200 metre loops at intervals of 200 metres along the profile. The transmitter produces a current in the loop which is rapidly terminated. This rapid change of current in the loop results in the induction of a current circulation in the ground beneath the loop, often described as a ‘current filament’. This current filament moves down into the earth at velocities proportional to the resistivities of the material in each layer. A multiturn coil connected to the receiver samples the variations in the secondary magnetic field at the surface resulting from the current filament, as it sweeps down through the earth materials. These variations in the secondary magnetic field contain diagnostic information on the resistivities and thicknesses of the layers encountered. The maximum contribution to the response results from material in close proximity to, and directly below the transmitter loop. This is in contrast to ground contact electrical sounding surveys that may be affected by lateral changes in subsurface layering due to the large array expansions required to achieve the depth of interest. These field data points of apparent resistivity are numerically inverted into true depth-resistivity format using a combination of ridge regression and smooth inversion techniques. Good depth resolution is ensured due to the twenty channels recorded for each transmitter range at every station. A typical presentation of the data is in colour resistivity sections combined with plan maps of conductors at depth. Interpretable features include depth to bedrock, shear zones, resistivity contrasts due to pore fluids conductivity variation, porosity, mineralisation, alteration or silicification. The instruments large dynamic range means that it is responsive to both changes in rock types and in alluvial stratigraphy. The transient electromagnetic (TEM) sounding method is a powerful surface EM technique for obtaining accurate subsurface geological information. With the Geonics Ltd. PROTEM system geoelectric section information that details vertical and lateral variations may be obtained with a minimum of field time and cost. The system is comprised of a PROTEM receiver and is used with a family of transmitters, each suited for a range of depth of exploration. The TEM47 is optimised for sounding work to a depth of approximately 70 metres. The higher powered TEM57 transmitter is used to provide the intermediate and lower frequency repetition rate required to obtain deeper information. For very deep soundings the high powered TEM37 or TEM67 is used. In operation, a transmit loop appropriate for the depth of exploration is laid on the ground surface. A common loop size for very shallow work is 5 by 5 metres. Deeper investigations, using the TEM57 transmitter, utilise larger loops. The transmitter produces a current in the loop which is rapidly terminated. The rapid change of current in the loop results in the induction of a current circulation in the ground beneath the loop, often described as a ‘current filament’. This current filament moves down into the earth at velocities proportional to the resistivities of the materials. A multiturn coil connected to the receiver samples the variations in the secondary magnetic field resulting from this current filament, as it sweeps through the earth materials. These variations in the secondary magnetic field contain diagnostic information on the resistivities and thicknesses of the layers encountered. The maximum contribution to the response results from material in close proximity to, and directly below the transmitter loop. This is in contrast to ground contact electrical sounding surveys that may be affected by lateral changes in subsurface layering due to the large array expansions required to achieve the depth of interest. The data are recorded digitally and plotted as apparent resistivity versus time in log-log format. The twenty channels of recorded data result in approximately two decades of coverage, at ten points per decade, providing good layer resolution. This would be the rough equivalent of a current electrode expanding from a few metres to hundreds of metres for a conventional Schlumberger vertical electrical sounding. The data are modelled as depth-conductivity format using a ridge regression inversion technique. Field loop layout and sampling of the transient takes very little time so very high sounding densities are economical. Either as individual soundings for widely distributed geological information or for rapid continuous profiling, the transient electromagnetic sounding method is an effective and reliable technique. Buried metal detection is most frequently carried out with sophisticated geophysical techniques, that provide improved depths of exploration and object discrimination in comparison to conventional inductive metal detectors. Frequent targets for metal detection surveys include underground storage tanks (UST), drums, pipelines, unexploded ordnance (UXO) and hazardous metal waste. Geophysical techniques frequently employed for metal detection include magnetometer, ground penetrating radar and time domain electromagnetometer. Time domain EM systems such as the Geonics Limited EM61 series provide a powerful, effective means for rapid and accurate detection of buried metal objects. The EM61 has advantages over magnetometers that include much better lateral location accuracy, greatly simplified survey interpretation, more accurate target depth calculations, excellent cultural rejection, and detection of both ferrous and nonferrous targets. The magnetometer method may however, be utilised to explore for metallic objects at depths that exceed the nominal 3 to 4 metre maximum depth range of the EM61. The EM61 technique has advantages over ground penetrating radar that include greater penetration in conductive soils, faster operating rates and comparable spatial resolution. The Geonics EM61 consists of a coincident transmitter and receiver coil, that pulses 150 times per second and measures during the off-time between pulses. Between each pulse, the EM61 waits until the response from the conductive earth dissipates, and then measures the prolonged buried metal response generated from eddy currents in any metallic objects. The instrument is designed to isolate the signal generated by metallic objects from the response due to the electrical conductivity of the ground. The instrument is designed for high horizontal resolution and rejection of the influence of metal objects to the side of the instrument. As a result it is relatively insensitive to interference from nearby surface metal such as fences, etc. and as such it can be used on sites with known metal features and metallic debris. A highly portable hand-held version of the transmit-receive coil system is available. The EM61 is capable of high rates of survey production and is utilised either in the wheel mounted mode for open areas or in the one-man portable configuration. In practice, grids are established with a maximum line spacing of two metres in order to detect smaller targets such as buried tanks or drums. An odometer is used for positioning in the wheel mounted mode, and grid stations are used in man portable mode. In some cases, an integrated GPS system may be used for automated positioning information. The data are provided by the instrument in millivolts, which are logged digitally and can be downloaded to a computer for processing. The figure above illustrates the results of an EM61 survey to locate buried underground storage tanks. The survey clearly delineated the location of two, 8000 gallon fuel tanks that were buried parallel to the edge of an existing building. The effect of rebar is also evident in the anomalous concrete pad immediately east of the building. The land streamer surveying utilises Geometrics Geode, signal enhancement seismographs, together with a multicomponent land streamer. Vertical and horizontal impact sources are used to provide seismic energy. Field procedure entails positioning the streamer and operating the compressional and shear wave sources to acquire the seismograms. The streamer is then towed to the next interval point and the process repeated. The streamer geophone spacing of one metre provides high resolution data on shallow layering and the bedrock surface. The interpretation of the combined compressional wave and shear wave data entails refraction and reflection processing that results in shallow, high resolution earth material velocity sections. A combination of common mid-point seismic reflection, method of differences and Applications Resistivity profiling or imaging is a method for investigating the subsurface by measuring the capacity of earth materials to pass electrical current. On land or overwater, this technique is effective in detecting boundaries between materials that have contrasting electrical resistivities. Clays and water saturated materials are generally electrically conductive and contrast sharply with more electrically resistive materials such as gravels, glacial till, bedrock, or frozen ground. Resistivity exploration can be carried out to depths that range from a few metres to several hundred metres under favourable conditions. Historically, recording of resistivity information was carried out using only four electrodes and one of the standard geometric arrays. The advantage of resistivity imaging is that by exploiting the ability to redundantly sample very large numbers of electrode combinations, a detailed resistivity image of the subsurface is developed. Instead of simple layering information, resistivity imaging can resolve small and irregular anomalies even in areas of complex subsurface geometry. The method is based on generation of an artificial electric field in the earth by introduction of current through metal electrodes. Utilizing one of a large variety of standard array configurations, a voltage is measured across two electrodes. This voltage, together with the current value and a constant based on the array geometry, yields an apparent resistivity reading of the underlying geological layering. In field operation, the metal electrodes are inserted into the ground at the required separation along the section to be profiled. Wider electrode spacings result in deeper penetration. Intelligent nodes are then connected to the electrodes that allow each to be in either standby, current or potential measuring modes. These nodes are controlled by an automatic multi-electrode switching system that steps through the programmed combination of electrodes. A number of companies offer this instrumentation, some of which include the capability to measure the induced polarisation effect as well. The data processing is carried out using a package such as RES2DINV. This package uses a finite difference modeling approach to calculate the resistivity values that best fit the observed data. An iterative least-squares method progressively increases the fit for each run of the forward code. The resulting profile is the best estimate of the true resistivity section and is displayed in colour contour format in ohm-metres for interpretation. Traditionally, self-potential surveys have been carried out in mineral exploration to locate and delineate conductive mineral deposits. These surveys were most successful where a strong oxidation-reduction potential was present in the mineralized body. In addition to conductive mineral deposits, self-potential anomalies may also be attributed to the flow of subsurface fluid or heat. In the environmental and engineering fields, self-potential surveys are carried out almost exclusively for the detection of seepage through earthen water retention structures such as dams, dikes, reservoir floors, unstable landslide areas and canals. In addition, surveys have been successfully completed to locate structures such as faults, to detect seepage through membranes and to delineate flows around wells and in geothermal areas. Self-potential or streaming potential anomalies in an earthen structure are caused by fluid flow through the porous medium and ion exchange between the fluid and soil particles within the zone. Related to head difference, fluid resistivity, fluid viscosity and the potential of the electric double layer, these streaming potential effects produce relatively small voltage anomalies that are readily measured at the ground surface, below water in the impoundment area, or in drillholes. Measurement of these voltages provides information on the location, flow magnitude and the depths and geometries of subsurface flow paths. Negative anomalies occur where seepage enters a structure or flows horizontally with positive anomalies occurring where the flow is generally ascending and surface seepage occurs. Flow path maps are developed that are extremely valuable for planning drillholes and piezometer installations and for remedial measures planning. Streaming potential surveys have been successfully employed not only to detect anomalous seepage conditions but also to evaluate remedial measures emplaced to control seepage. Pre- and postgrouting surveys in an earthen dam for example, would reveal a change in the magnitude of streaming potentials and provide a means of assessing the effect of grouting operations. Streaming potential surveys are generally carried out with a fixed base electrode and a roving measuring electrode with station locations determined by pre-surveyed grid, or GPS positioning. Survey procedure consists of traversing the structure and recording individual station readings that are referenced against the fixed base station. Streaming potential profiles or if data density permits, contours in millivolts are produced that are evaluated for anomalous conditions. More recent advances in electronic data acquisition allow for automated operation and recording of streaming potential values with permanent or semi-permanent electrode arrays. Streaming potentials can be measured at frequent, preprogrammed intervals over the entire array which facilitates early recognition of anomalous conditions and provides a means for frequent evaluation of changes in readings at anomalous locations. The significance of streaming potential anomalies is greatly enhanced by comparison with the detailed geological and hydrogeological data provided by resistivity imaging surveying. This is facilitated through the use of a new electrode design that enables coincident recording of both streaming potential and resistivity data. The addition of a second, complementary geophysical data set provides confirmation of the interpretation and a greater understanding of mechanisms and paths of anomalous seepage flow.Acoustic and Optical Televiewer Logging
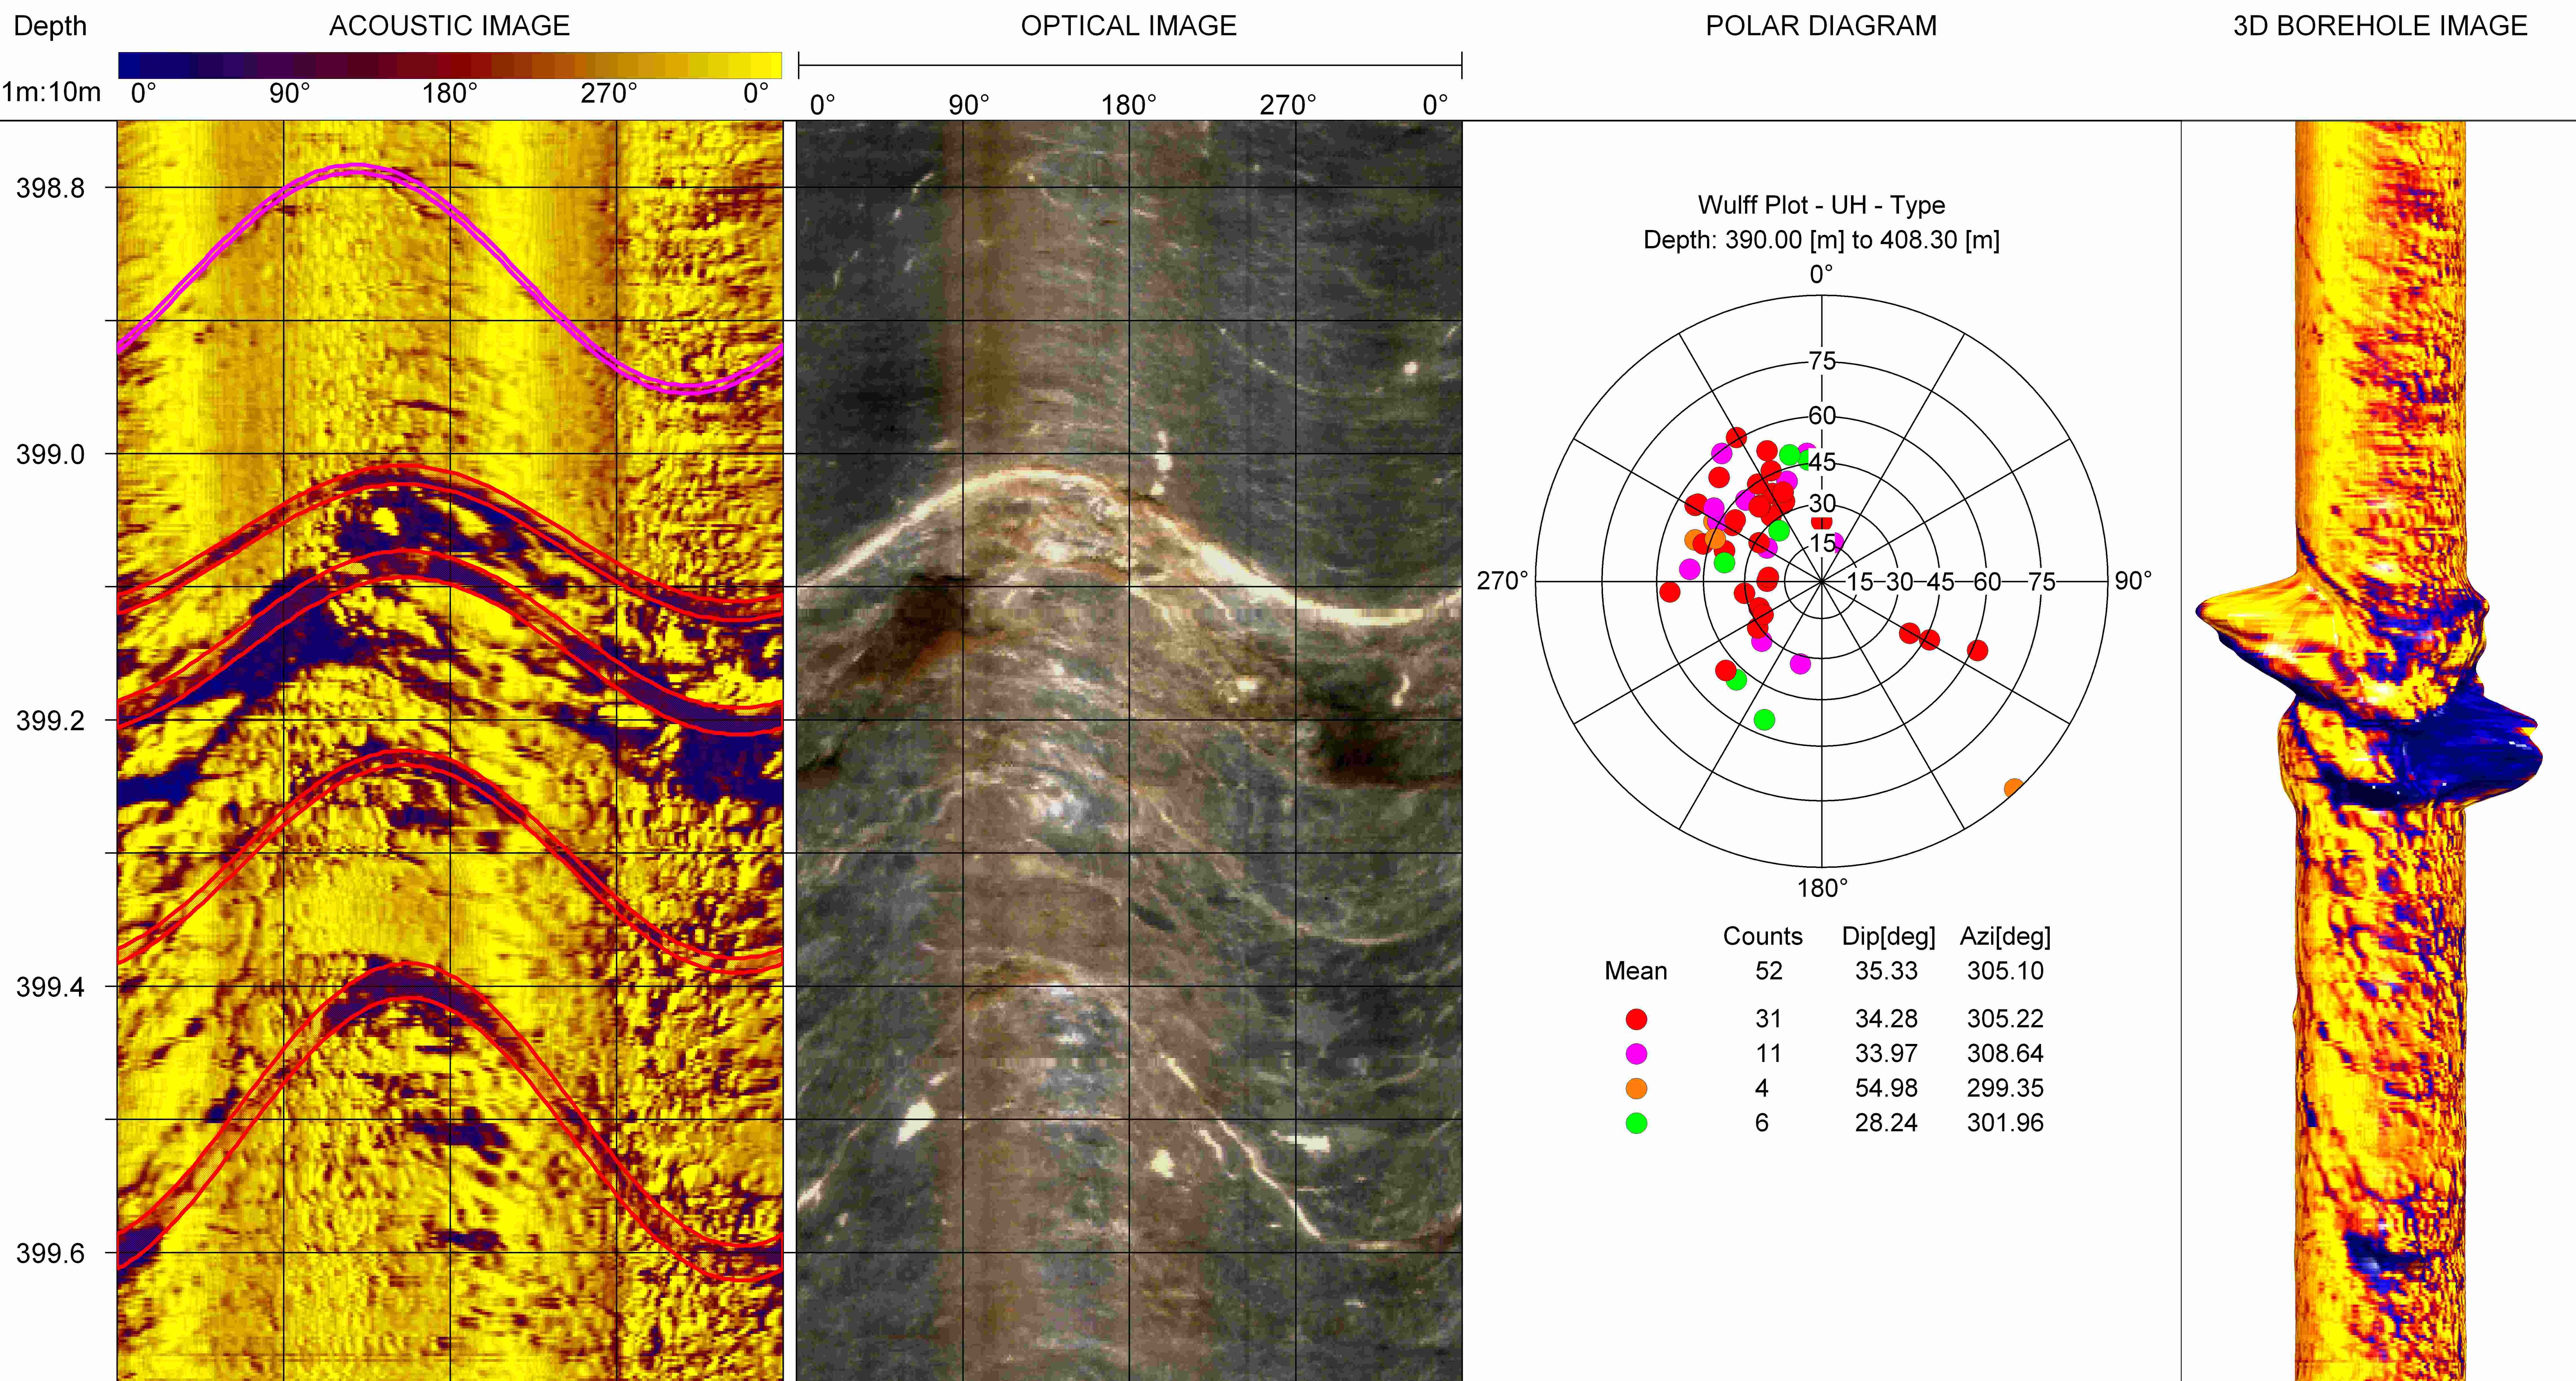 Borehole acoustic and optical televiewers provide a means to visualize, orient and measure borehole features in-situ. Televiewer logging can augment and in some instances replace coring in areas with low-core recovery or missing core.
Borehole Seismic
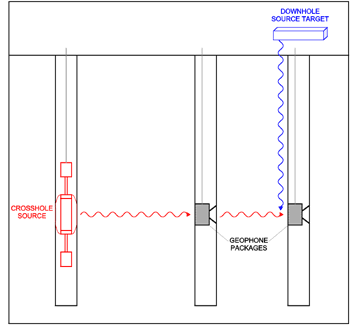 At the ground surface, a vertical mechanical source such as a sledge hammer, seismic shotgun, or weight drop is used to generate a compressional wave. This vertically incident compressional wave arrival is recorded by the vertical geophone in the receiver package and stored digitally in the seismograph. For downhole shear wave measurements, a wooden or metal beam is held fixed to the ground surface and impacted on each end to produce shear waves of opposite polarity. These horizontally incident shear wave arrivals are recorded by two horizontal geophones in the receiver package. Once the compressional and shear wave data have been recorded at a depth point, the receiver package is moved to the next depth position and the procedure repeated.
 Casing Deviation
Crosshole EM Imaging
 A unique Crosshole Electromagnetic system has been developed to image geological conditions between boreholes. The equipment is based on the electric field technique which provides greater sensitivity and detectability than systems based on the magnetic field technique. At the low conductivity range, where most geological situations occur, the electric field is more sensitive to variations in conductivity. The system measures amplitude and relative phase of the received signal. Attenuation of the signal relates to conductivity between boreholes, which in earth materials has a much larger range of variation over other physical properties such as density or acoustic velocity. Antenna frequencies vary from the high kilohertz to low megahertz range which allow for high resolution and significant penetration range especially in more resistive environments such as bedrock.
Ground Penetrating Radar (GPR)
Induced Polarisation
Magnetics
Multi-Spectral Analysis of Surface Waves
Ground Penetrating Radar
Overwater Acoustic Profiling
Seismic Reflection
Seismic Refraction
Seismic Tomography
Electromagnetic Terrain Conductivity
Transient Electromagnetic (TEM) Fixed Source
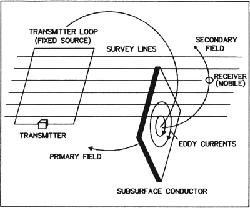 Transient Electromagnetic surveying is a proven technique for massive sulphide exploration. Either in the surface large loop fixed source mode, or in the downhole configuration, the system detects potential massive sulphide zones and provides enhanced definition of conductive mineralization.
TEM Profiling
TEM Sounding
Buried Metal Detection
Land streamer seismic surveys
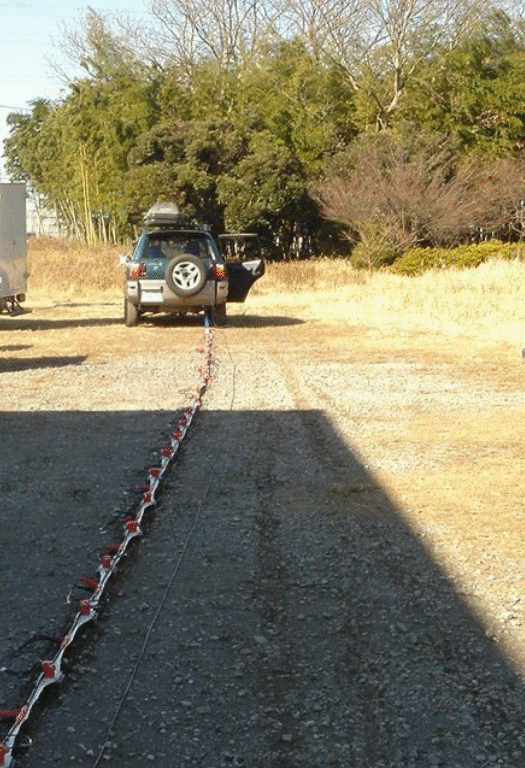 Land Streamer surveys entail towing a flexible streamer behind a vehicle with geophones at close spaced intervals. This approach allows the rapid collection of shallow Seismic Refraction, Reflection and MASW data along a road or trail surface. The approach allows high survey productivity, significantly reducing cost per kilometre as compared to conventional methods.
Resistivity Profiling or Imaging
Self Potential Surveys
